The Measurement and Calibration of Sound Reproducing Systems is Tooles paper and includes Olives research. This AES Open Access document can be downloaded without an AES membership. Jumping to Figure 14:
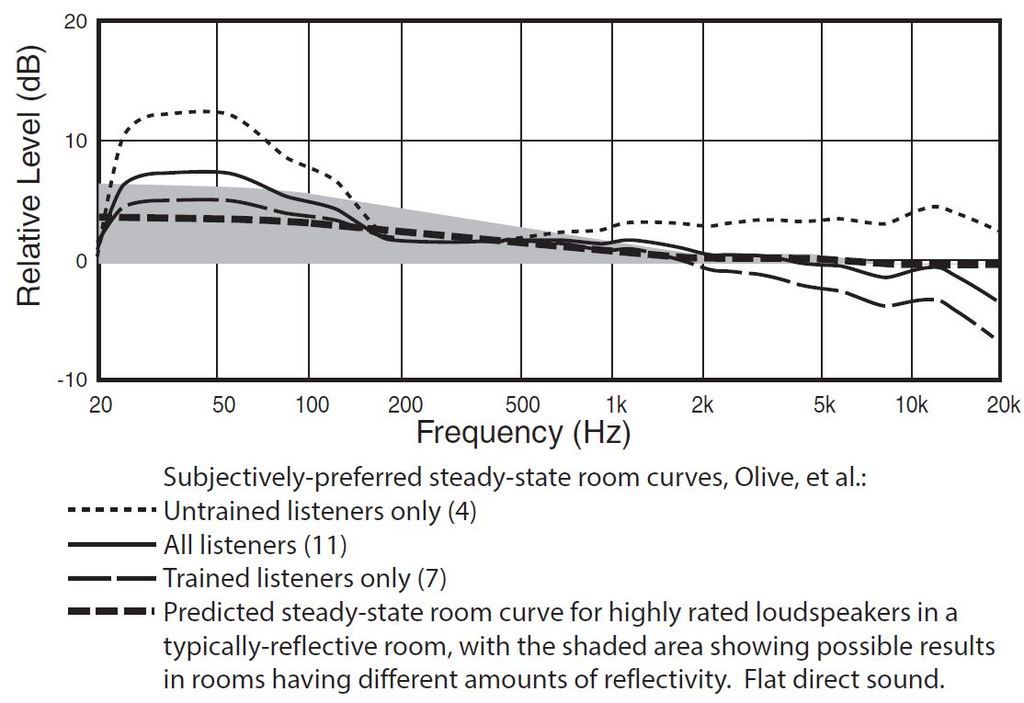
My JBL 4722 stereo config implements a small variation of the trained listeners preferred response above. Flat to 1kHz and then a straight line to -6 to -8 dB at 20 kHz depending on how lively or damped ones room is. And how much high frequency energy one can take with dynamically compressed music.
I agree with Greg Timbers, about eq and directivity. I use full range FIR filter eq, but because of the controlled or constant directivity waveguide, eq'ing the response on axis has a predictable and smooth off axis response across a wide sweet spot. If it is ok to link to another site with a few measurements:
http://www.avsforum.com/forum/89-spe...l#post48767385
Frequency Dependent Windowing (FDW) is the common theme of DSP software like Audiolense, Acourate, Dirac, Denis' DRC RePhase, and others. The idea is that the analysis and correction windows is long at low frequencies and sliding shorter as frequency increases: e.g. 750ms @ 20 Hz, 100ms @ 100Hz, 15ms at 1 kHz, and less than a millisecond @ 20 kHz. This more closely represents what we hear in small room acoustics. Acoustic and Psychoacoustic Issues in Room Correction by JJ Johnston explains why we hear what we hear in small room acoustics, hence why FDW.
So there is an element of the room at low frequencies, in addition to the speaker being equalized and as frequency increases the amount of room sound is windowed out to the point of just shaping the direct sound to match a target response for neutral, accurate sound reproduction. Most of these software packages allows one to custom design a FIR filter, including adjusting FDW size. Denis's open source DRC program is a good software and provides a detailed explanation of FDW, target curves, preringing, etc:
http://drc-fir.sourceforge.net/doc/drc.html
Personally, I use Acourate and very happy with the design and sound quality of the FIR filters. The linear phase digital XO is set to the factory recommended frequency of 650Hz for biamp operation and matching directivity of the low and high frequency sections. Digital XO enables one to time align the woofers and tweeters to an ideal speakers step response. The frequency response of the 4722 can be equalized to almost +-1 dB across its operating range, covering a wide sweet spot. As an ex recording/mixing engineer, this is the level of precision and accuracy I look for in a control room/monitor system. But with the high efficiency of the 4722, the sound is dynamic, even at low volumes. I listen mostly at 83 dB SPL which means low distortion from the 4722. It has been fun and sounds great to my ears. Recommended.
Hope that helps.
Cheers, Mitch


 Reply With Quote


