Most measurement software, like smaart for example, calibrate their curve to show a flat curve for a pink noise spectral distribution.
This is better because it is the "normal" distribution in music. If you inject high level white noise into your speaker you may overload the tweeter (same symptome as the "not enough power" thingy), so white noise is really not the best for speaker measurement.
That was my point in post #7

Noise distribution vs frequency is only depending on the way you are performing the analysis
For example, pink noise distribution is flat with 1/n-ieme octave analysis (constant percentage bandwidth (CPB) resolution ie delta(F)/F = constant) while the distribution of the same pink noise is decreasing by 3dB/octave with FFT analysis (constant bandwidth resolution ie delta(F) = constant)

I have done some more measurements on my m552 and it turns out the vertical scale of the Audacity analyser is correct.
I measured a 1001Hz tone at 0, -20, -40, -60 dB (from the denon test cd) and this was exactly replicated in the Audacity analyser graphs.
So, I'd say the above graphs I made are pretty accurate.
So I did some more analysis. I built myself a 3-way (see in the DIY section) for which I use the m552 in mono 3-way mode. The following is the output on the "mid" channel when crossed over at 200Hz and 4000Hz, according to the scales on the front of the m552. In reality it looks like 200Hz and 3000Hz ! Also 2000Hz on the scales turned out to be 1500Hz in reality.
So before you say that "it doesn't sound good at xyz", you should probably try and measure the output as in this case it differs substantially.
ok, I get it, seems sensible to not load the tweeter with the same "full" signal as the wooferOriginally Posted by pos

you can also use a linear sweep, generated with this:
http://www.satsignal.eu/software/audio.html#SweepGen
(you have to choose the "linear" option, as well as limit the duration to something like 20s as audacity is limited to 23.8)
I have bought an M553 for my active 3-way project, here are some audacity graphs comparing the FFBREQ and CCBREQ settings.
The first graph is the mid output with the lower crossover at 18Hz and the upper at 450Hz. It is just for level comparison:
The second graph is the high output with the crossover at 450Hz and CCBREQ:
The third graph is the high output with the crossover at 450Hz and FFBREQ:

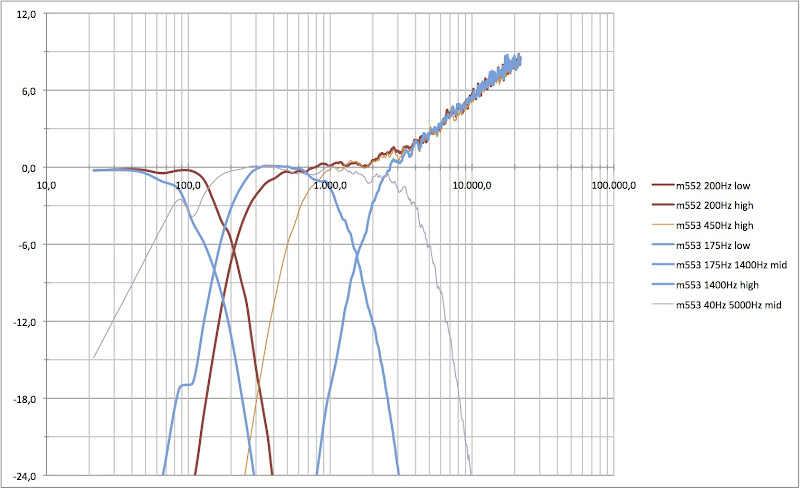
Pfff, three years on, I am still doing it... Here some more measurements I did today after finding out how to compensate Audacity for pink noise. You take a full spectrum and take that as a reference in Excel, instead of just publishing the Audacity curves. Then in Excel you get this for the M552 and M553, both on the 2380 CD compensation settings:
I adjusted all the measurements to 0dB where they should be by adding or substracting xdB. You can see that the crossoverpoint around 175Hz is not perfect. The M552 seems better. Furthermore there is a strange wiggle in the M553 in both of the mid curves at 100Hz (blue and purple lines). But this is an old copy of the M553, I'll have to measure the one I am actually using.

As it was three years ago: Interesting...
bo
"Indeed, not!!"

Are you guys inducing a load on the output bands for these measurements?
Oldmics
There are currently 1 users browsing this thread. (0 members and 1 guests)
 Posting Permissions

 Reply With Quote