They were brand new from PE just over a year ago. I've played them all of a few hours or so total.Originally Posted by grumpy

Which reminds me that I also have a used one in an eBay 2410. Maybe I stick that on the 2370A for a look-see....


They were brand new from PE just over a year ago. I've played them all of a few hours or so total.
Which reminds me that I also have a used one in an eBay 2410. Maybe I stick that on the 2370A for a look-see....

Both approaches are flawed, so until either is perfected, common sense dictates the consideration of both, but taking neither as an absolute. Subjectivity lacks widespread, universally-interpreted terminology (one person's "airy" is anothers' "wheezy"), while objectivists lack a method of summing specifics to purvey the big picture of the perceived experience.
For the pusposes of disscussion though, I can only (subjectively) stand reading a minimum of "Brand X, Model Y sounds like crap because it's {insert adjective of choice}, Model Z just blows it away..." threads, because they tell me nothing. Explain the physical "why" however, and I get something of use to apply as I choose (try to explain a 6.5kHz notch without techspeak).
The underlying motivation for us audio nuts seems to be a desire to make a good thing better, or at least to get the most from what you have. Towards that end. objective observations lead to solutions, subjective discussion leaves you waiting for Brand X to produce a better model (which to be successful, must be improved by objective methods).
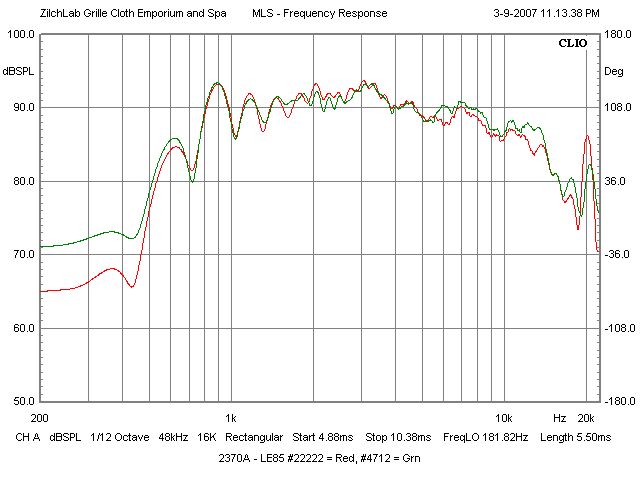
I'm anxious to see that, as I'm certainly not replicating the published 2370A response very well using "stock" drivers here:

1m away and on axis? (2370A Vert/off-axis plot) -grumpy
I'm 2m away, but I moved the mic up to 1m last night to see if that made a difference. It didn't.
I'm certainly on axis, but should confirm with a level that the horn face is absolutely plumb. 15° ain't all that much, now that I think about it, and the VHF is already down substantaily (10+ dB dropped) there according to that spec....
that's what I was thinkin'15° ain't all that much
w/ a high-pass cut off, it would look pretty close to the 15deg curve.
I don't have any 2370's or I'd try too... -grumpy
Nope, that isn't it. There's no FR sweet spot. I manipulated the horn/driver "live" watching RTA.
And it's not the measurement system, 'cause PT-F's flat as Kansas above, and on RTA just now, too.
Let's see what Rob gets.... :dont-know

Hello Zilch
Here's a pair or D8R2425 diaphragms from Ian. Don't know how old they are. They match up fine and look a bit more like the JBL curve. On the graphics just resize. You can pick them off the forum and rescale to compare. I am keeping them large so I don't loose resolution. I also don't want to change now.
Here are plots at 5 and 10 dB scale. The 10 dB scale is more in line with the JBL curve. As far as what's going on up top and why we don't see the plateau??? I am right down the throat so I don't understand the disparity??
Hello Edgewound
I am using 2 2426 cores for measurements. I am assuming that undamaged cores will be reasonably well matched. The original measurements was in a 2416 but I edited them out and remeasured in a 2426. The 2426 core is much easier to make changes and run curves with. The motors for the 2416 and 2425/26 are different enough that it made more sense to use the correct core for the diaphragm. I have 2416 measurements but they are to illustrate how JBL diaphragms are matched compared to the aftermarket 16 ohm 2425.
Subjective vs Objective
The idea I had when I started the thread was to see what if any observable differences there were using measurements of a stock JBL diaphragm as a baseline. I wanted to see just how different the AfterMarkets and the Radians were. I think we all agree that measurements are not the end all and be all some would like to believe they are. That said one area that they excel in is looking for differences that subjectively would be difficult or impossible to understand using music as a program source. I felt this was a better way than having to deal with all the unknowns trying to do a subjective evaluation. I thought if there were indeed audible differences we would get a better handle using measurements to try to understand what was actually happening.
To that end I have another pair of JBL left to go and an aluminum 2421 aftermarket to try. I hope everyone can understand what I have posted. I have not looked at distortion levels or impulse response in the measurements I have taken. I have kept them out for now as I think they might confuse things a bit. I will be trying them with a high-pass network to see what the impedance changes/differences do with a network in the mix. It's one thing looking at them on a horn but I think the impedance differences may also be an issue. The only way to know is to take a look.
Rob
Last edited by Robh3606; 03-11-2007 at 06:57 PM. Reason: Update Graph
I'd say we're getting similar results with 2425/6 on 2370A, Rob.
I'm looking for the HF plateau, and LE85 does it (kinda):
http://audioheritage.org/vbulletin/s...809#post155809
Quasi-anechoic MLS should be approximating JBL's curve, I would think, but neither that nor sinusoidal do....
Hello Zilch
What going on from 700hz and up to say 2k?? What does the raw curve look like?? It looks like you have ringing or you are gating too much off the measurement. Those are ungated measurements I posted after yours. Above 500Hz you should be able to get a good snapshot with not all that many issues from the room. Those are 10 sample averages about 6 inches off the horn. If you look both the Sine and MLS are almost the same. If you want to compare the measurements be a good idea to use the same core driver. I don't have any LE-85's around to try to correlate measurements.
Rob
I have a question. If you measure first, then listen, isn't there a very good chance you have already prejudged the speaker. For example the 6.5k dip, lets pretend thats a measuring error. When you listen to it, in the back of you mind you are thinking of the dip. Is it possible you would not like a speaker you normally would have liked, because of negative technical data? Maybe you would try to fix something that shouldn't be fixed? I think a large part of HiFi might just be made up in peoples heads.
I like to listen, then measure, then listen again. I then misinterpret the results and start from scratch, more determined than before, but with not much more information on how to actually change the damn sound to what I want.
I should experiment with different distances and see if I can't come up with something more optimum.
Presently, the windowing is telling me, in this setup and space, that I can't get reliable results down that low, so I ignore them.
I know there's lots of readers interested in the bottom end of horn/driver performance, but I don't want to trade off accuracy at the high end in these studies.
Next time Mr. Widget comes over, maybe he can help me with this, but I believe he found that, even in his space, 800 Hz was about the lower limit. It could easily be I read him wrongly on that, tho. Perhaps he can provide some clarification here.... :dont-know
I can't run a horn/driver combination for listening without measuring it, because it needs a compensation filter, the characteristics of which I determine from the measurements, which may intially just be RTA. Something like that notch is going to be apparent at even the lowest resolution here.
It also needs to be accurately balanced with other system components for the listening to be meaningful. I can't do that by ear.
Call it a bias, perhaps, but after several years of working with this now, I look at the curve and know immediately what's going to sound like poop, and that there's no point in listening until it's "in the ballpark." I haven't done it yet, but, yes, you can bet I'll be listening for that notch, and I can virtually guarantee that, if it's real, it'll have to be fixed for those diaphragms to be usable on that driver and horn combination. That may be something as simple as realigning the diaphragms.
Nobody knows better than a curve junkie that what we hear is in substantial part, in our heads. That's why I recognized from the very start that I couldn't do this without instrumentation.
There's some disconnect here. You need to determine the curve of the sound you want, then try to match it with compensation. Trying to do that with music is a recipe for madness, in my experience -- too many variables. You tweak yourself to death....
Zilch, Its all maddness, haven't you learned that by now.
I was half joking, but there are so many variables besides speaker response. I know the sound I want. If I listened to a speaker and thought it was bright and then measured it. Lets say the graph came out flat to 20k. I would probably think to myself, I like a slightly rolled off speaker and try to fix it that way, by rolling the highs. It would almost never work. It would turn out to be the directivity or a slight peak in the upper midrange. Very seldom would it be the obvious (to me) stuff.
What we need is a software program that would overlay all possible measurements and then it could sort the results by personal preference.
DEQX presently manipulates multiple parameters. It's coming....
There are currently 1 users browsing this thread. (0 members and 1 guests)
 Posting Permissions

 Reply With Quote